The US Bitcoin (BTC) ETF launch is significant because it allows more investors to gain exposure to BTC through conventional trading accounts, and it means that traditional finance (TradFi) asset managers are involved. While other ETFs were introduced outside the US, the significance and depth of the ETF market in the US make it a milestone. My findings indicate that Bitcoin now trades more like traditional financial assets, with distinct daily patterns tied to Traditional Financial hours.
Different regimes
There are two main regime structures that I identified. Notably, these regimes closely resemble those found in commodities and foreign exchange markets.
Week versus weekend
Weekday trading patterns are distinctive because of their activity and clear intraday patterns (which I describe in "Trading sessions"). The presence of these patterns suggests a greater level of professional involvement in DeFi markets, and the introduction of the ETF has reinforced this trend.
Weekends tend to be more homogeneous. They have overall lower volumes and display lower differentiation between trading sessions. This is most likely because such flows are dominated by retail, which can be less informed and more "random".
Trading sessions
Trading sessions loosely correspond to when a region is active. There are three main trading sessions.
| Session | Start | End |
|---|---|---|
| Asia | 00:00 UTC | 06:00 UTC |
| Europe | 08:00 UTC | 16:30 UTC |
| Americas | 13:30 UTC | 20:00 UTC |
The timing of the session is also influenced by daylight saving time. In the paper, the data are solely from the wintertime, so there is no consideration of this effect. We note that sessions can overlap with one another, such as the American session and the European session.
Historically, each session corresponds to a local anchor, which is a prominent financial centre.
- Asia is anchored mainly in Hong Kong and encompasses activity in Singapore and Tokyo.
- Europe in anchored mainly on London, and encompasses activity in mainland Europe centres (Amsterdam, Frankfurt, Paris, Milan).
- Americas is anchored mainly in New York and comprises activity in Chicago.
We note that Dubai, a prominent crypto hub, is at this stage not a distinct session and behaves like a bridge between Asia and Europe.
Findings
What the ETF introduction changed
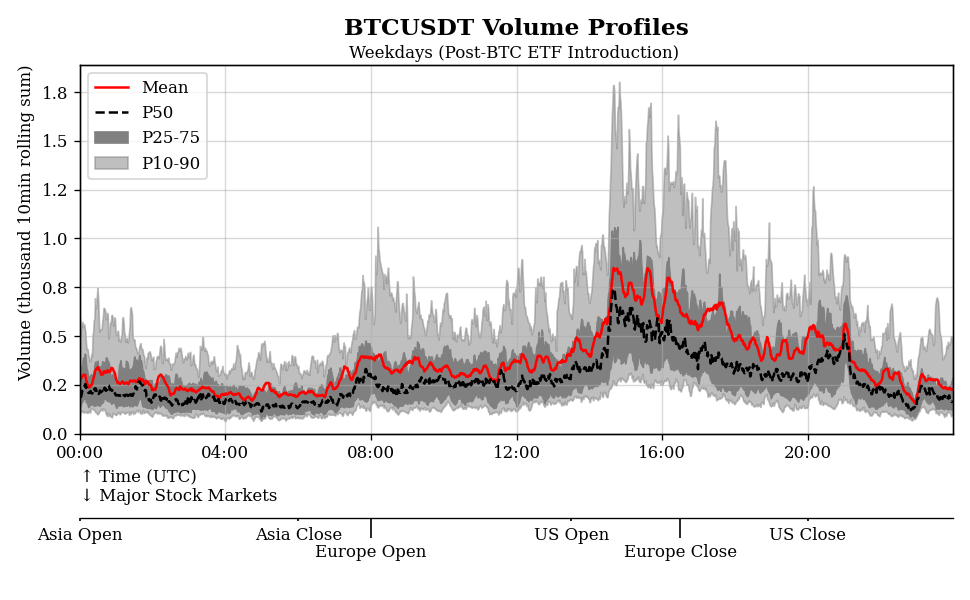
Bitcoin volumes have increased significantly after the introduction of the US Bitcoin ETF on January 11, 2024.
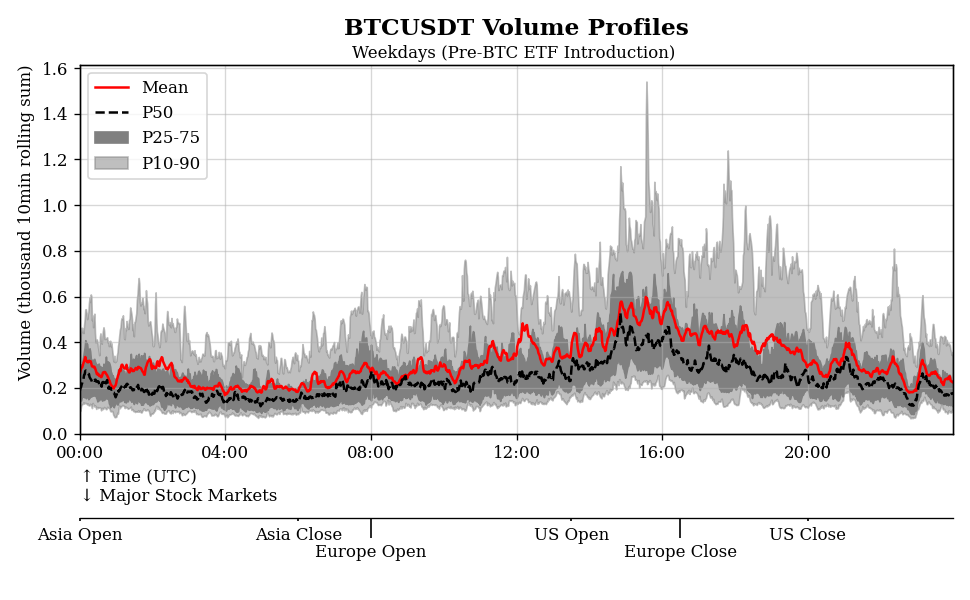
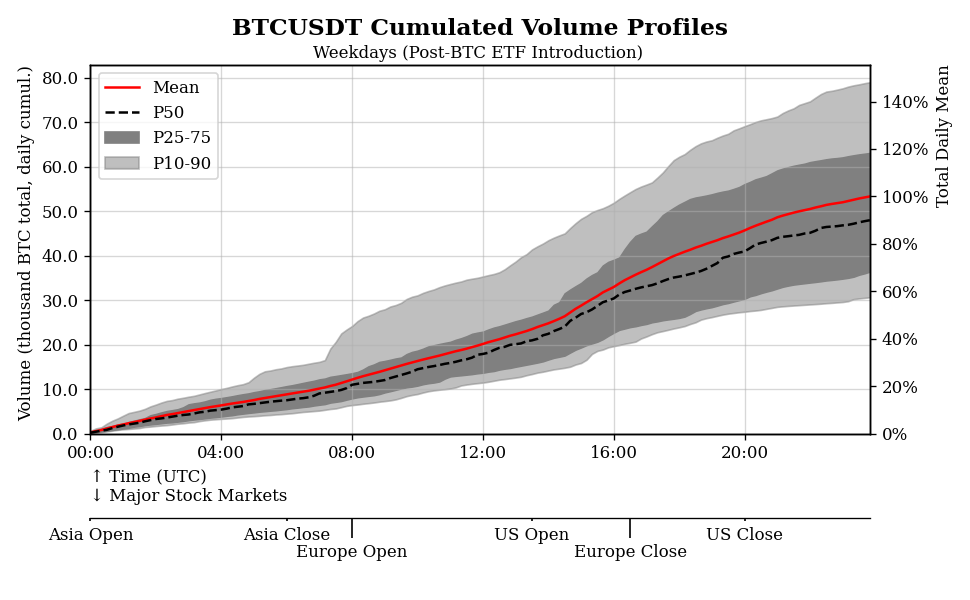
The volume surge is most pronounced during US hours, where the ETF is based, and around fixing times (see "Fixing times matter").
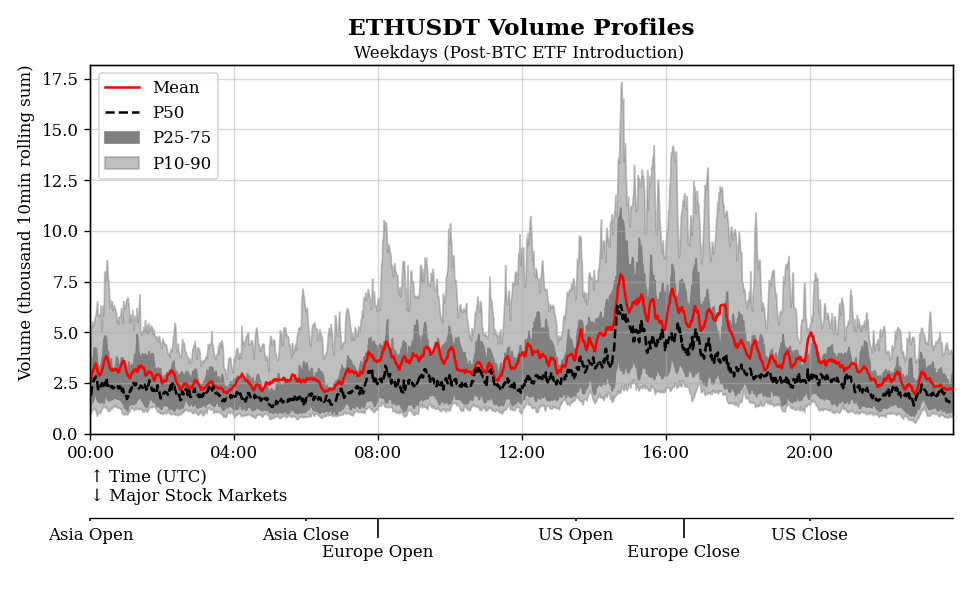
This has led to clearer liquidity regimes across most regimes. It was also surprising to see that ETH also saw changes in its patterns, despite the ETF only being introduced for BTC in the US at this stage.
Bitcoin follows TradFi regimes closely
The greater involvement of TradFi asset managers, via these ETFs, is observed in the data. As for most of traditional finance, and mirroring what is already observed for commodities, the US hours have become more important for DeFi. Both volatility and volume, proxies of market activity, have increased.
The fact that such patterns are still not observed on the weekends strengthens our hypothesis that thsi is due to professionla involvemen,t not increased retail particupation.
Fixing times matter
Fixing times are set hours when asset managers "fix" the value of their positions. In order to rebalance their funds under management at a rate as close as possible to the fixing rate, they tend to trade more actively around such hours. Two fixing times were notable.
- The London 16:00 fix, which is the market reference in foreign exchange.
- The ET 16:00 fix in US hours, which corresponds to the close and overlaps with the CME futures reference rate time. The fixing alone now represents around 20% of the daily volumes.
We can expect the US fixing to become increasingly important over time.
Methodology
This post refers to my paper Impact of US Bitcoin ETF Introduction on BTC and ETH Intraday Regime Seasonality, which was published in Proceedings of the Future Technologies Conference 2024. A public version is available on SSRN.
I analyzed trading data 2 months before and 2 months after the BTC ETF launch in the United States, on January 11th, 2024, to highlight the impact of the introduction of the ETF. I have used data from Binance, the world's largest cryptocurrency exchange. I also checked with Coinbase data, which was more influenced by US hours, but eventually only published the results from the Binance data.
I used data for BTC/USDT and ETH/USDT, with USDT the most commonly used stablecoin (Thether) pegged to the US Dollar at that time on Binance. My methodology relies on one-minute volume bars, smoothed over 10-minute windows to remove noise in the figures.
Our main objective is to identify changes to so-called liquidity regimes. Liquidity regimes are periods when volume and volatility are homogeneous, and they are usually linked to trading systems being run on a single set of configurations.
Read more
You can view the references I quote directly in the paper text.
Research on liquidity patterns is still ongoing. I think one of the best references is Lehalle and Laruelle's Market Microstructure in Practice (World Scientific), although it tends to focus on European equities. A mathematically robust material focused on liquidity is Guéant's The Financial Mathematics of Market Liquidity (CRC).
On-Chain NFT
This paper is represented on-chain by NFTs on the following chains. The metadata is compatible with Schema.org JSON-LD standards for agentic AI discovery, parsing, and citation.

BTC and ETH display intraday seasonality
The January 2024 approval of the US Bitcoin ETF was hailed as a watershed moment. What actually changed in the market?