The Federal Reserve Beige Book is a qualitative report, issued eight times per year, that is critical to the Fed's decision-making process for setting interest rates. It is one of the very few such reports that is not quantitative, and processing it quantitatively is a challenge. It is also unique in its structure: each of the 12 local Fed branches writes a section about its local economy.
Given recent advances in large language models (LLMs), I experimented with various models to quantify the report's outcome. I found discrepancies depending on the training set, and that some local Fed branches were more accurate than others at representing the broader tone of the report.
Selecting LLMs
LLMs have become front and center in 2023 with the introduction of ChatGPT. They actually are a much older technology, with more specialized models. There are typically two primary variables for a given model.
- The model shape is how the different trained components are connected to one another. This will directly impact the number of words (also referred to as tokens) the model can analyze and the nature of its output.
- The model training set, on which the weights were calibrated. As we will see, this was a significant differentiator in our study.
I chose two popular expert LLMs, BERT and RoBERTa, and for each, two different training datasets.
| Model Name | Model Family | Training Data | Development Team |
|---|---|---|---|
| DistilBERT | BERT | GLUE & SST-2 | HuggingFace |
| FinBERT | BERT | Financial reports | HKUST |
| Twitter RoBERTa | RoBERTa | Twitter data | Cardiff University |
| SiEBERT | RoBERTa | Diverse English sources | University of Groningen |
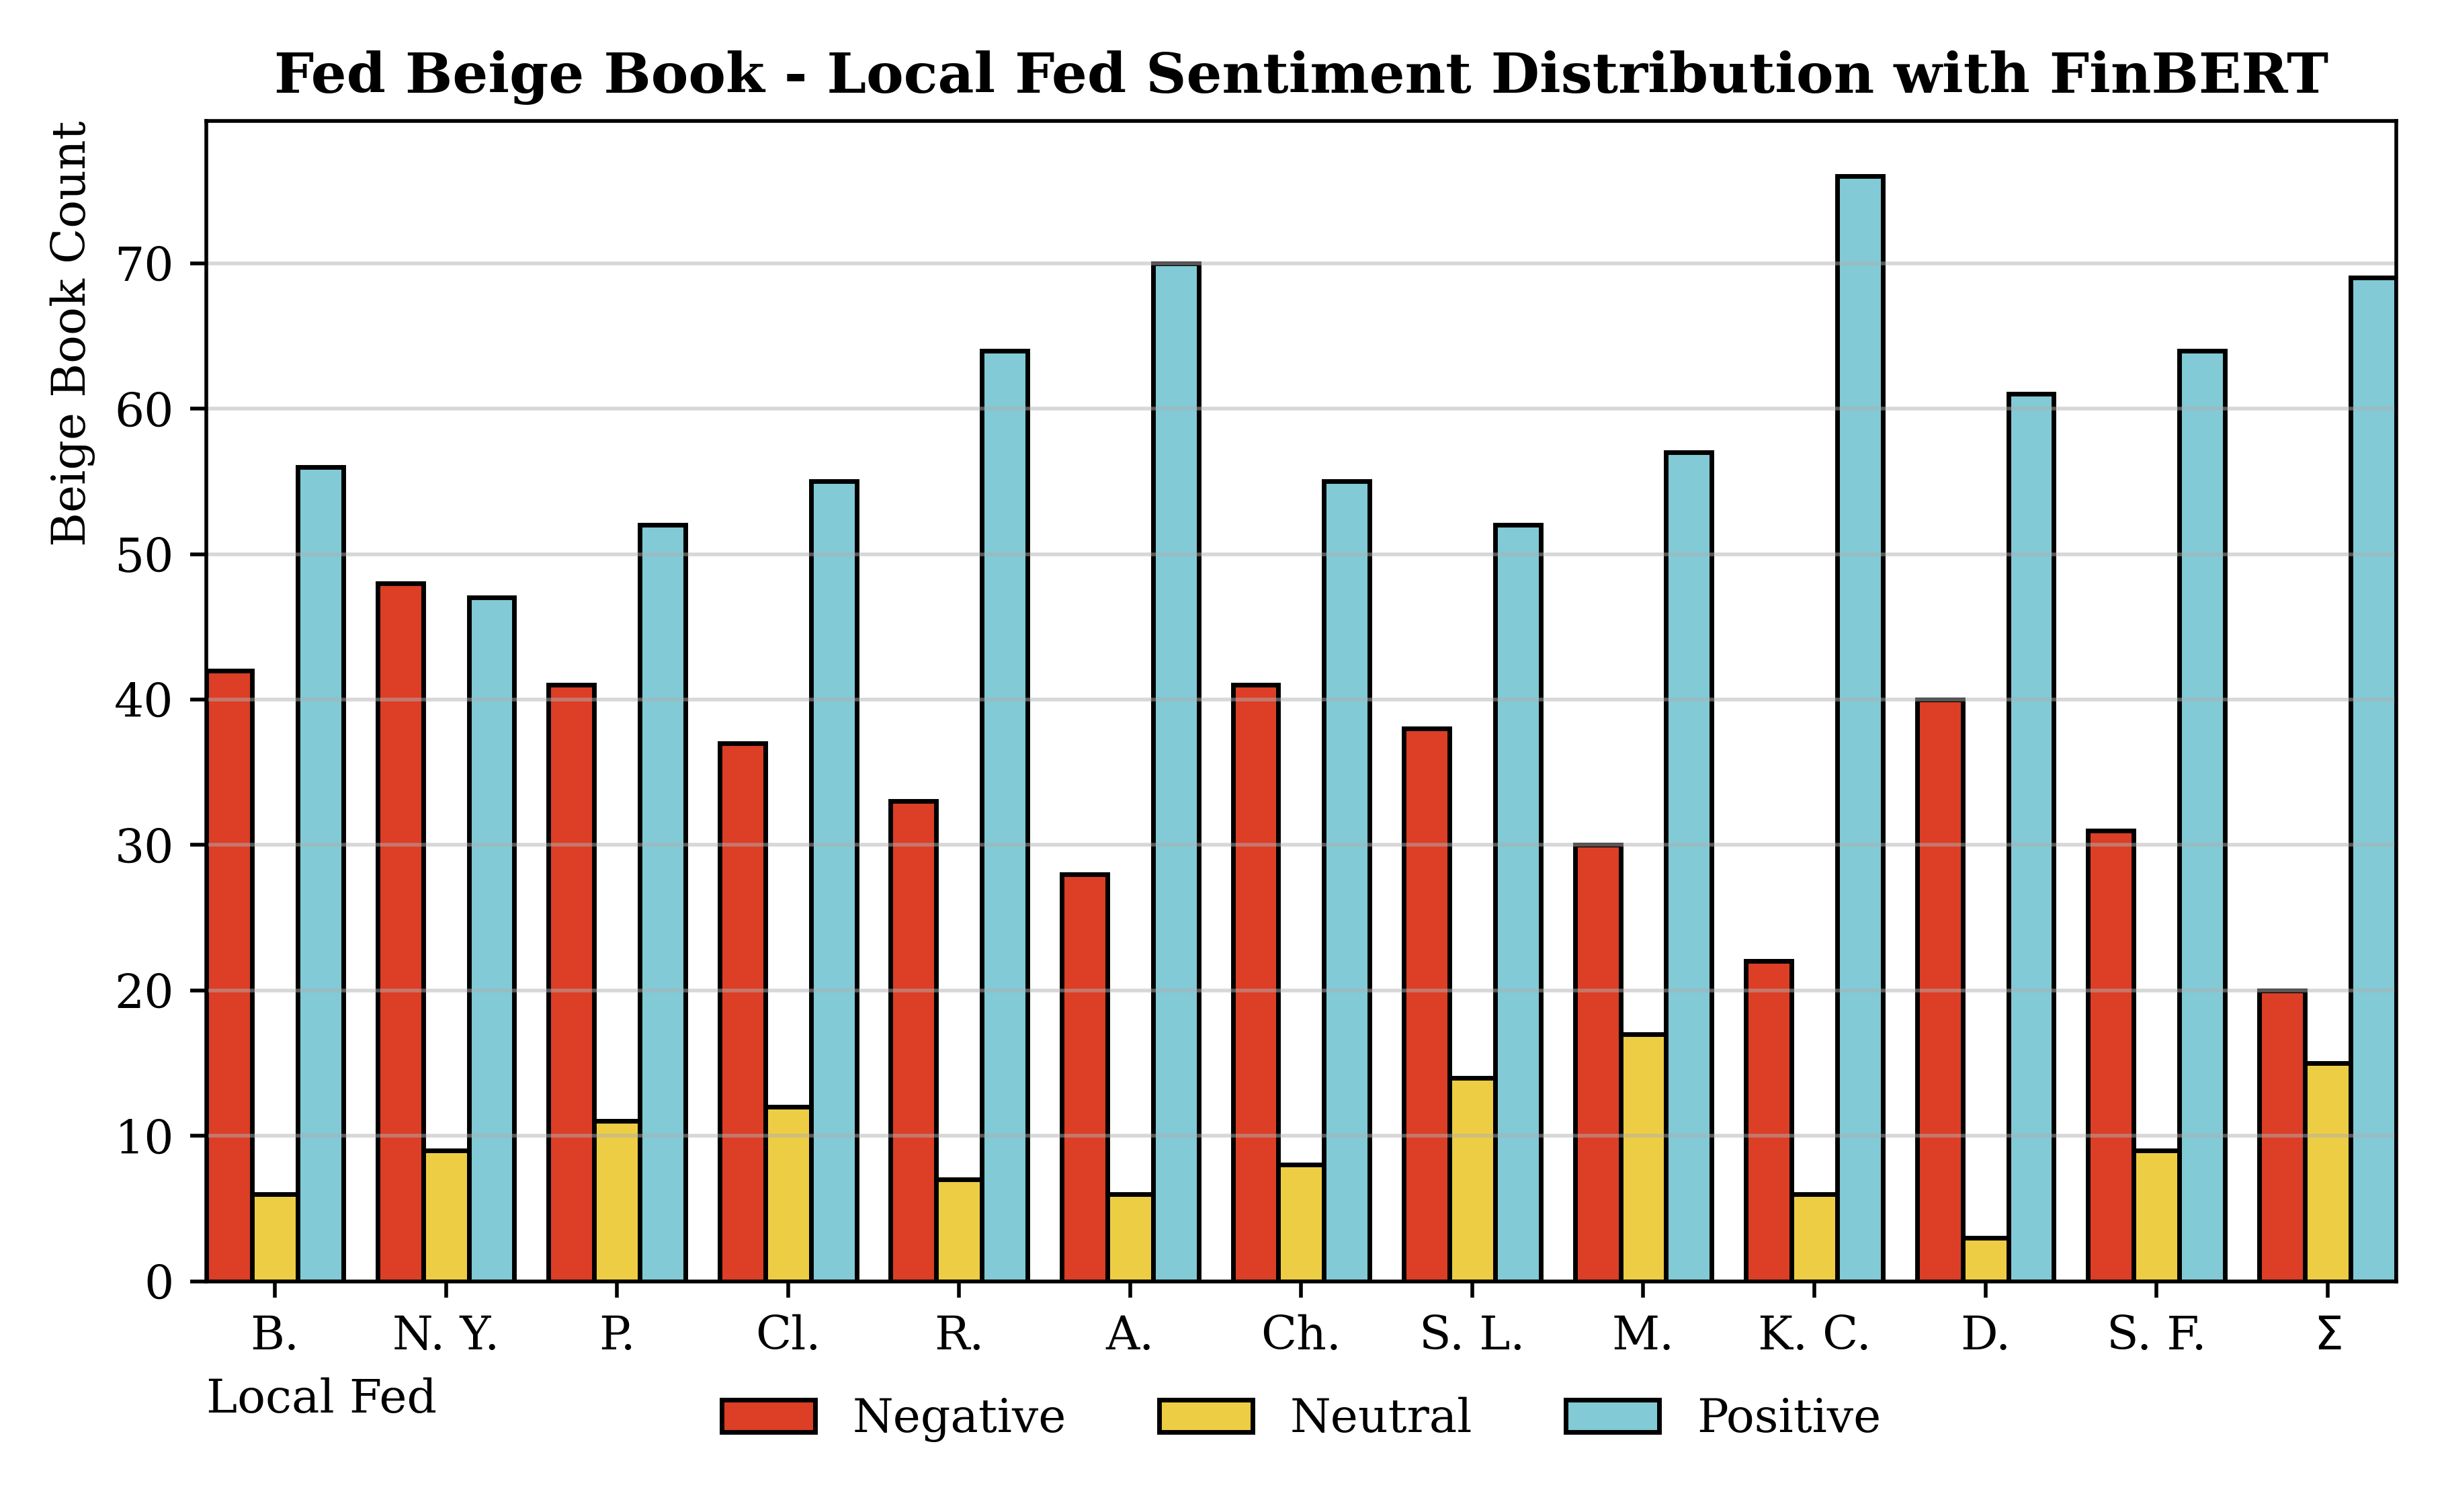
Each entry in the reports was classified as either positive, negative, or neutral. I prefer models that assign few entries to "neutral", which I refer to as decisiveness. As an example, sentences describing strong economic growth would correspond to positive labels, while entries expressing economic uncertainty would be labeled as negative.
Analyzing the reports
I analyzed the ports using all these models and scored them separately for the summary and the entirety of the report.
FinBERT wins
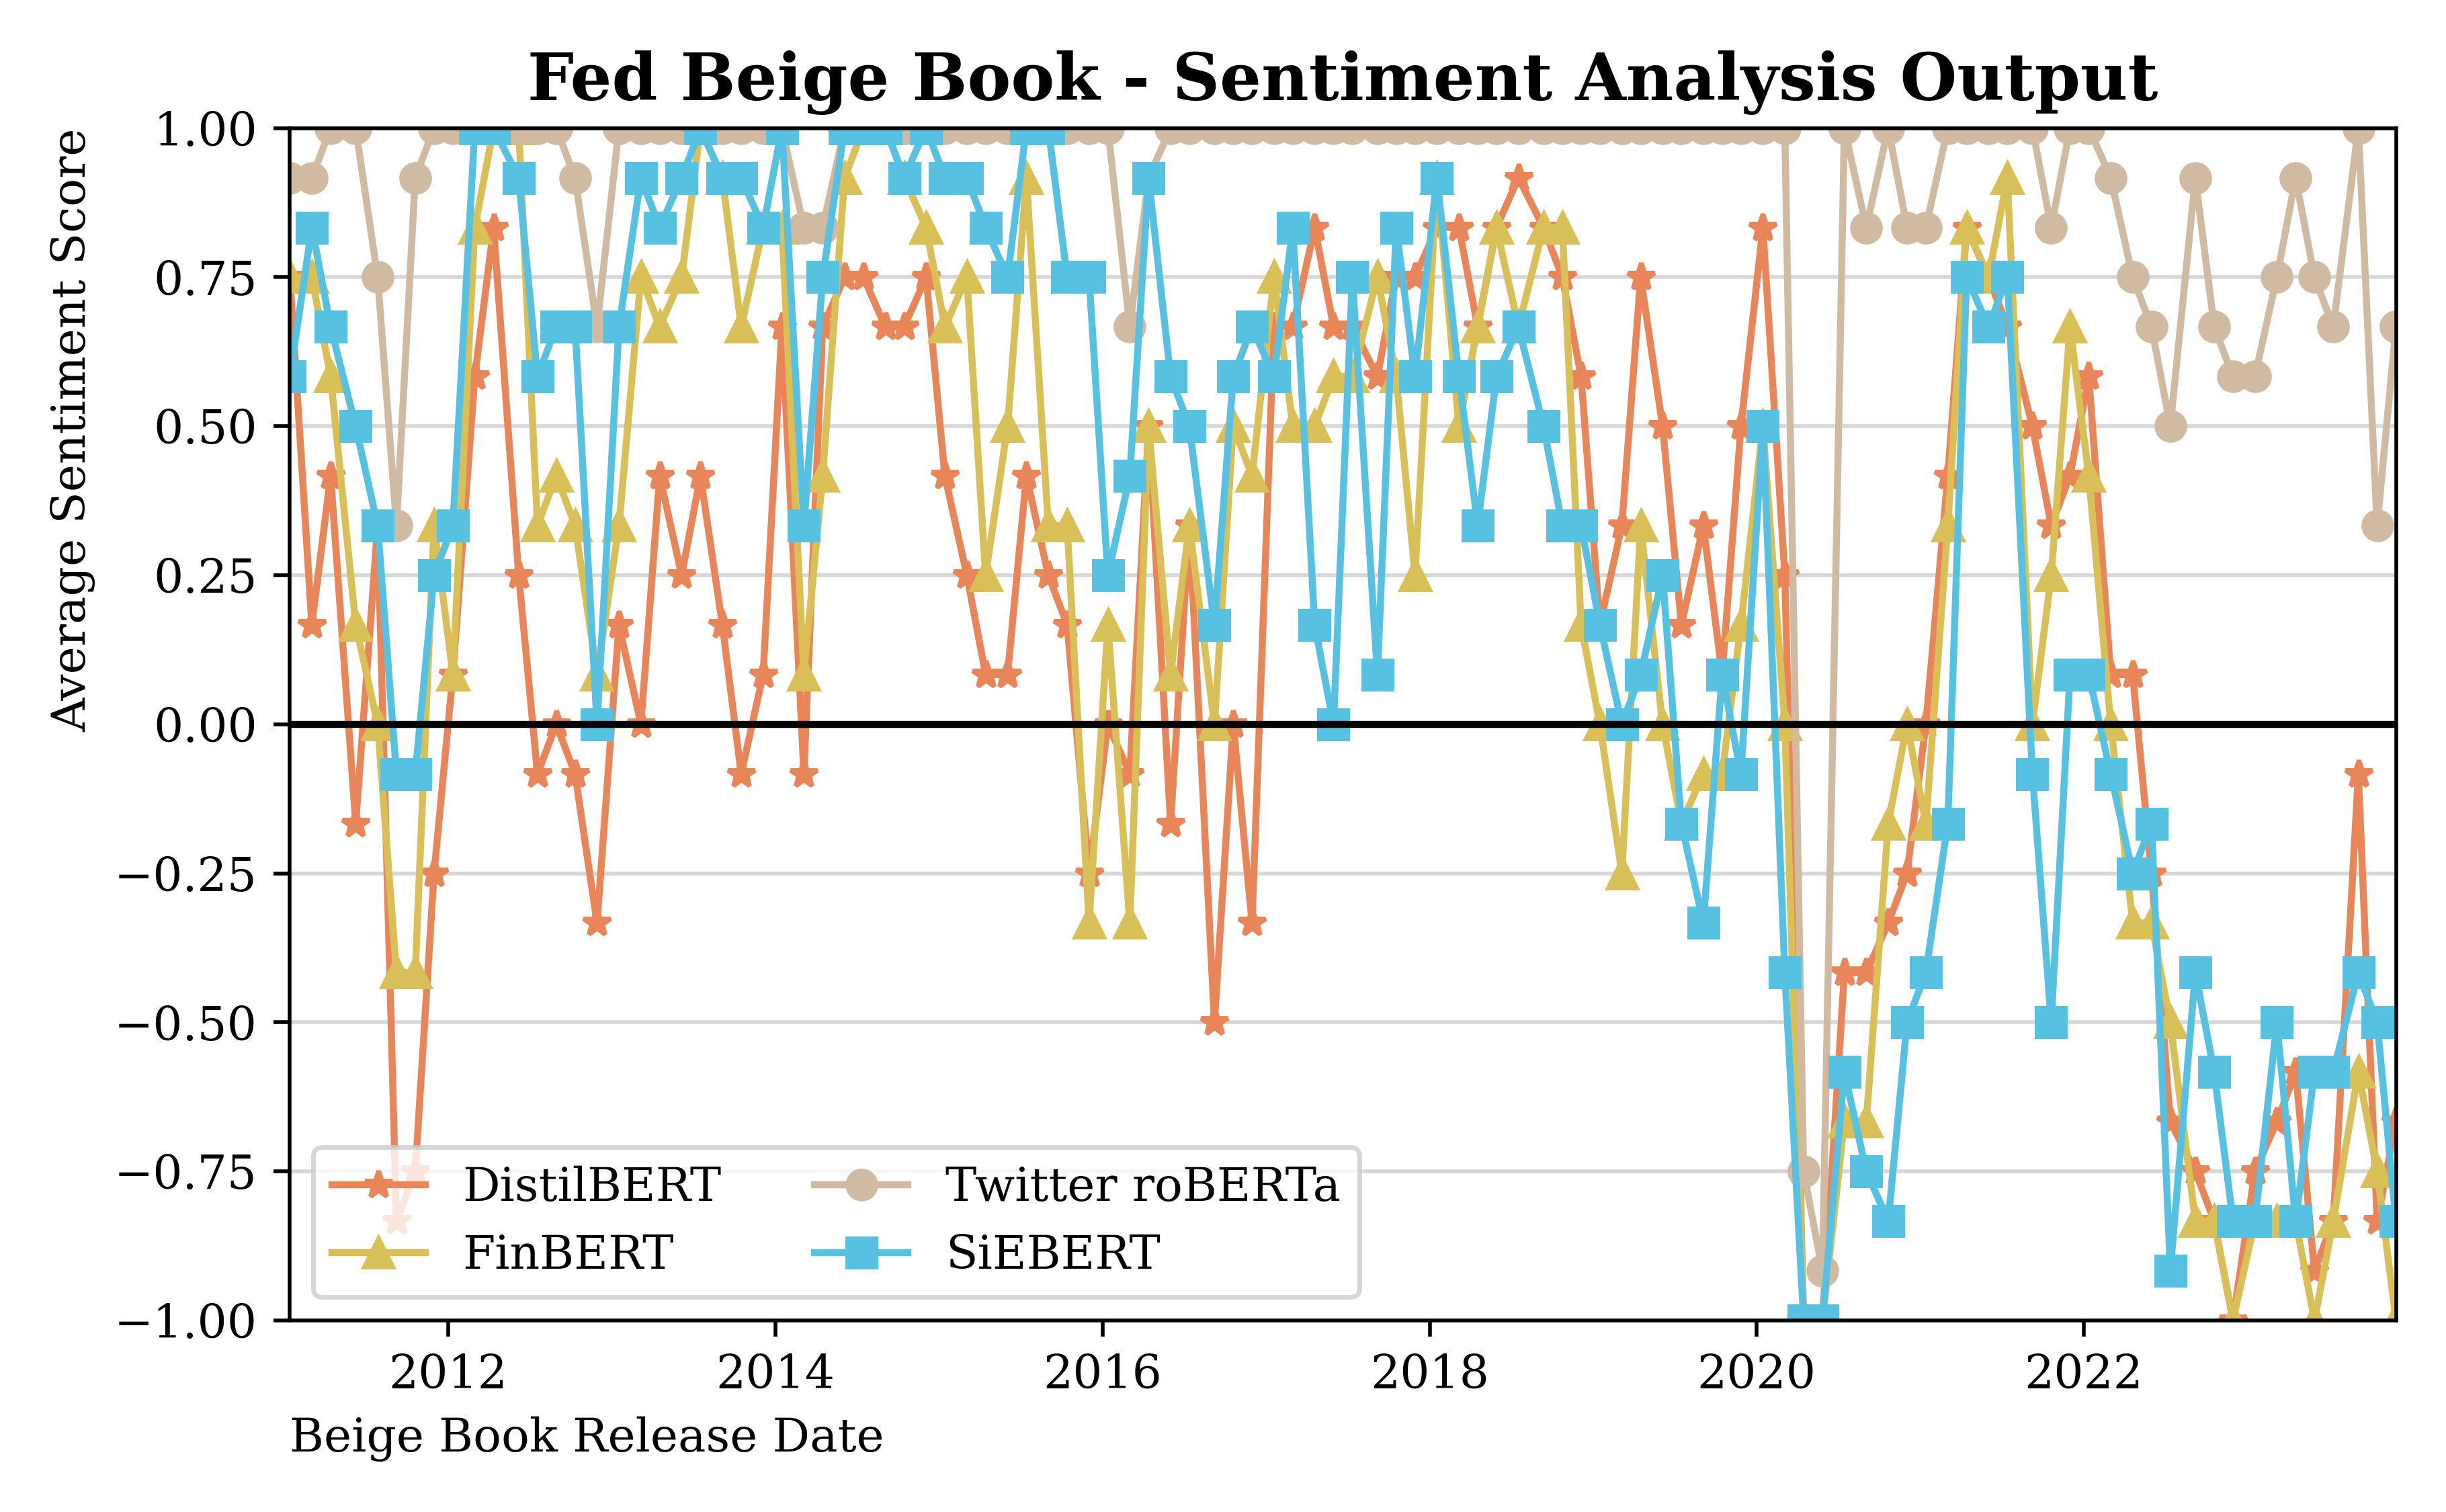
Out of all the models, the clearest outlier was Twitter RoBERTa. It was by far the worst performing, which I attribute to its dataset. Given that it was trained on Twitter data, it is not finely attuned to economic reports. On the other hand, FinBERT performed best, and, notably, it was trained solely on financial data.
SiEBERT actually performed well too, and is the other RoBERTa model alongside Twitter RoBERTa. The reason why I preferred FinBERT is that it had slightly higher error clustering in its predictions compared with FinBERT. SiEBERT is, among all models in the dataset, the "generalist".
It is likely that clustering issue is due more to randomness that actual udnerperformance.
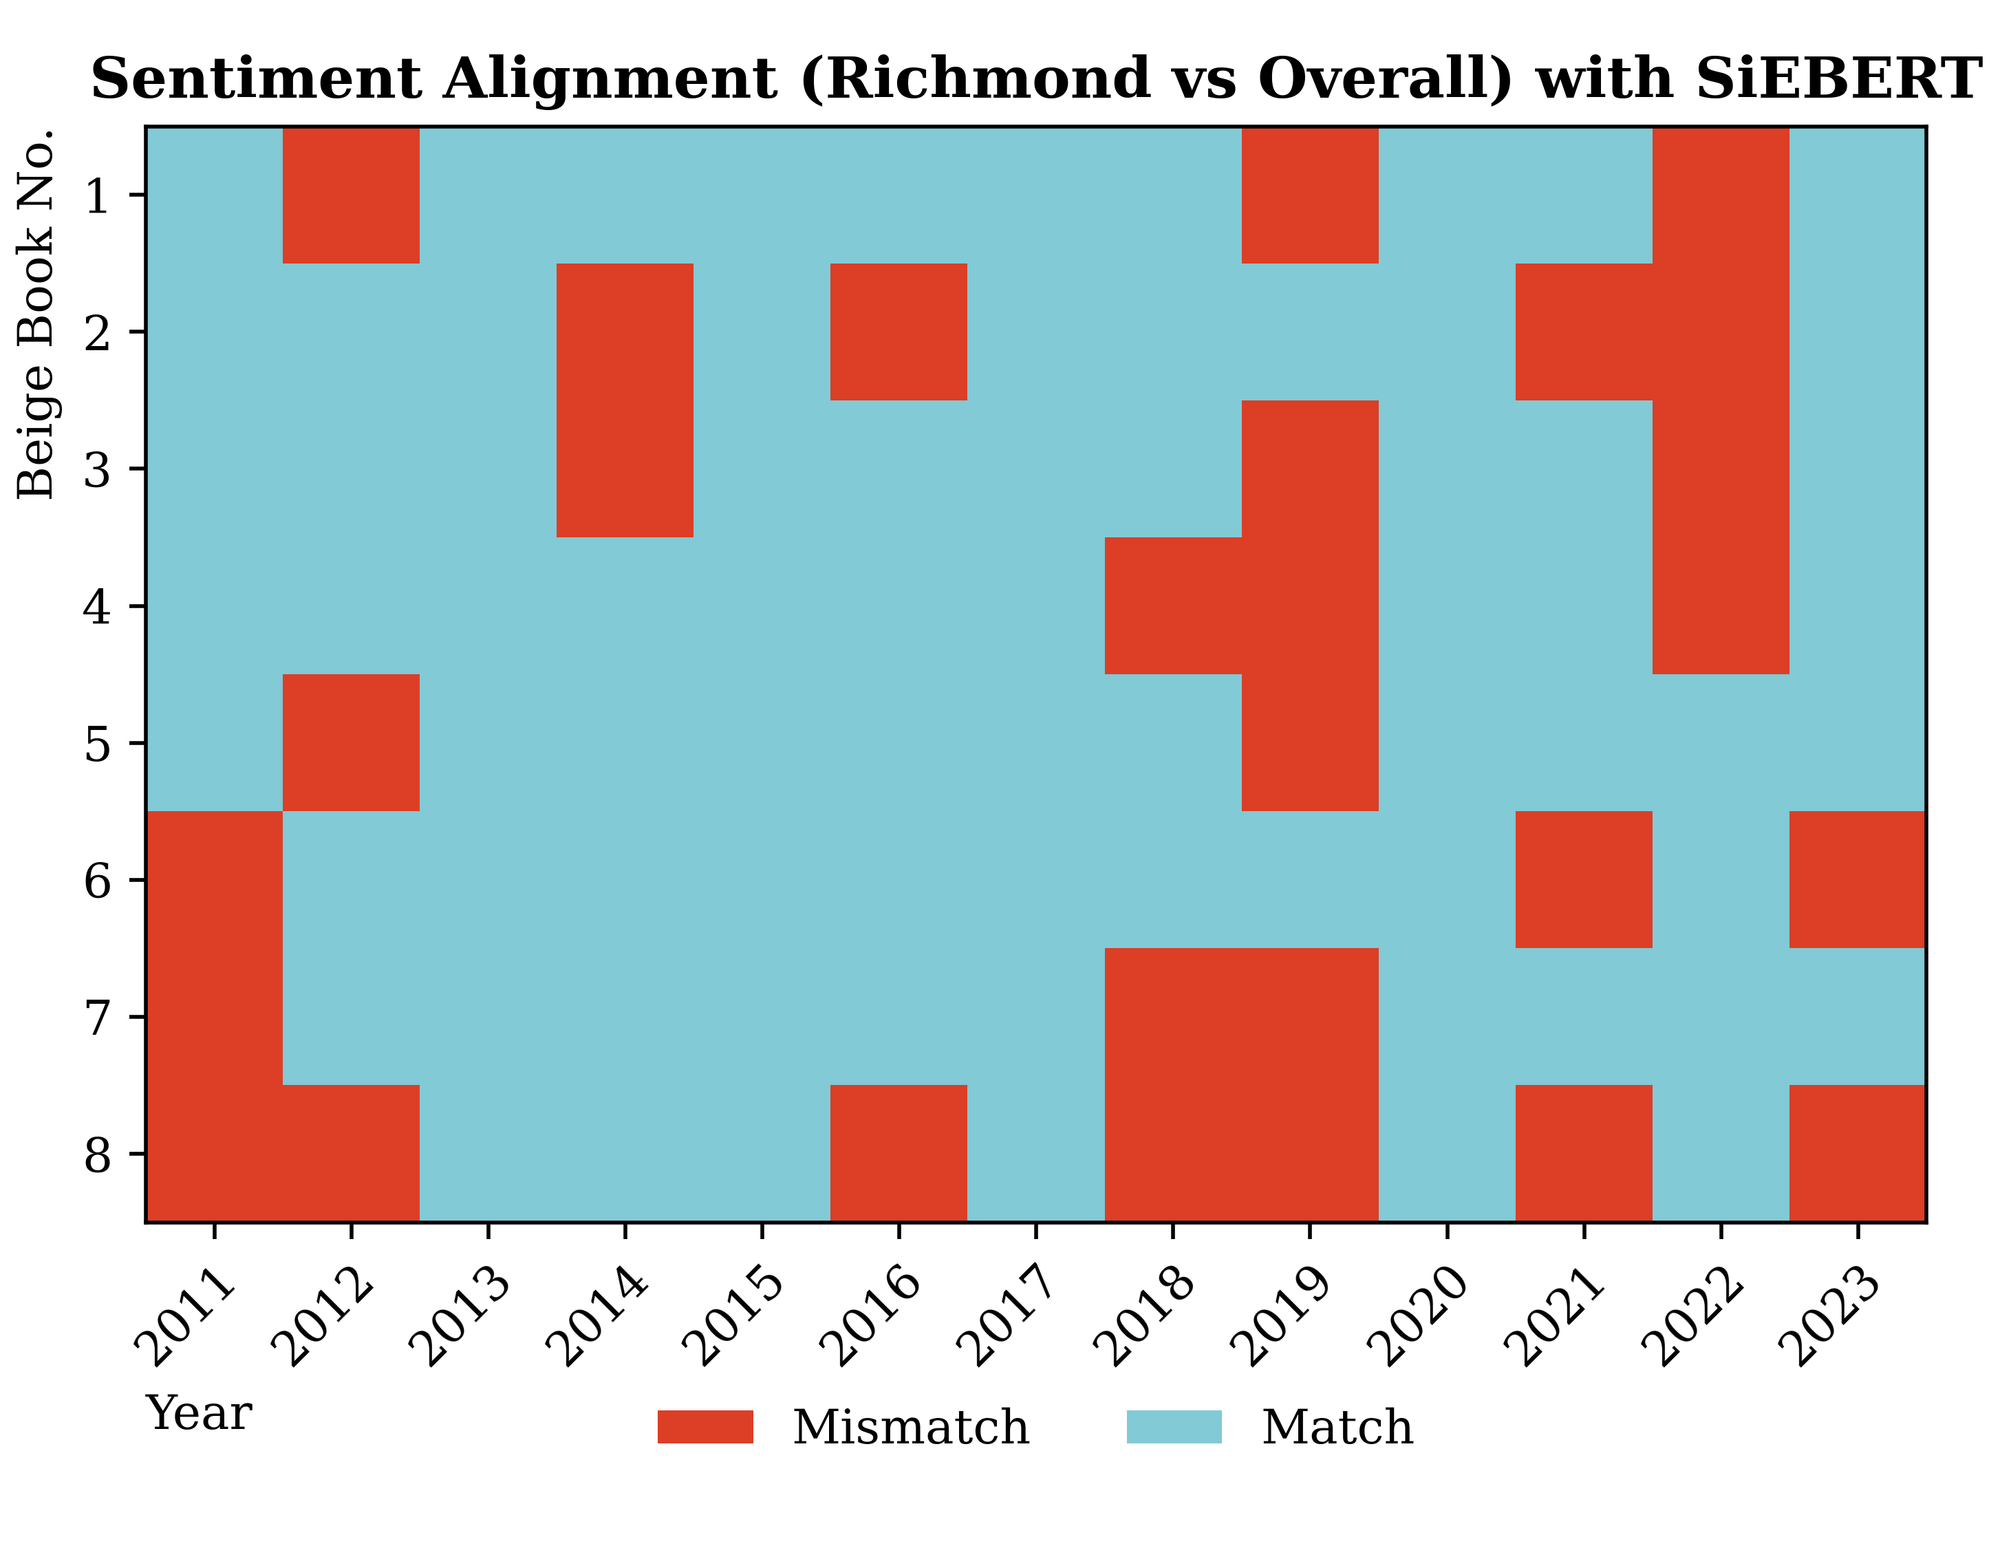
Richmond and Kansas City Feds
Not all local branches of the Fed accurately reflected the broader Beige Book sentiment. Two local Feds actually seemed to outperform; these were the Kansas City and Richmond branches.
Cleveland also performed well but had a slightly higher variance compared with Kansas City and Richmond. I do not have any apparent reason why these Feds tend to be more representative of the overall sentiment. When thinking in Economic terms, it actually makes little sense given that those districts are among the smallest. For reference, below are the Fed District sizes, and we can see how large San Francisco's is.
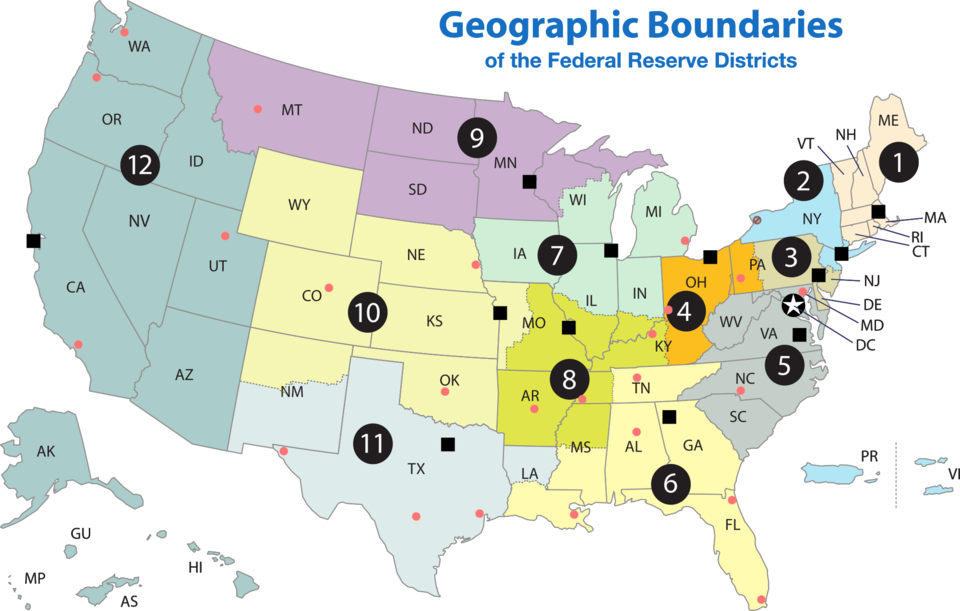
In practice, this means that just analyzing the sections corresponding to either of these two Feds is most likely to yield the same conclusion as for the entire report. This is more of an interesting result than a practical one: the reports are not very large files, and the computational cost of analyzing more entries is negligible.
The COVID anomaly
Our dataset, spanning from 2011 to 2023, includes the COVID-19 pandemic. It is very clear in the data that the sentiment deteriorated steeply during the pandemic itself. All models displayed that dip in sentiment.
Correlation with economic data
I compared the sentiment and its correlation with key macroeconomic data. This part did not show a strong correlation, which is due to the nature of the report.
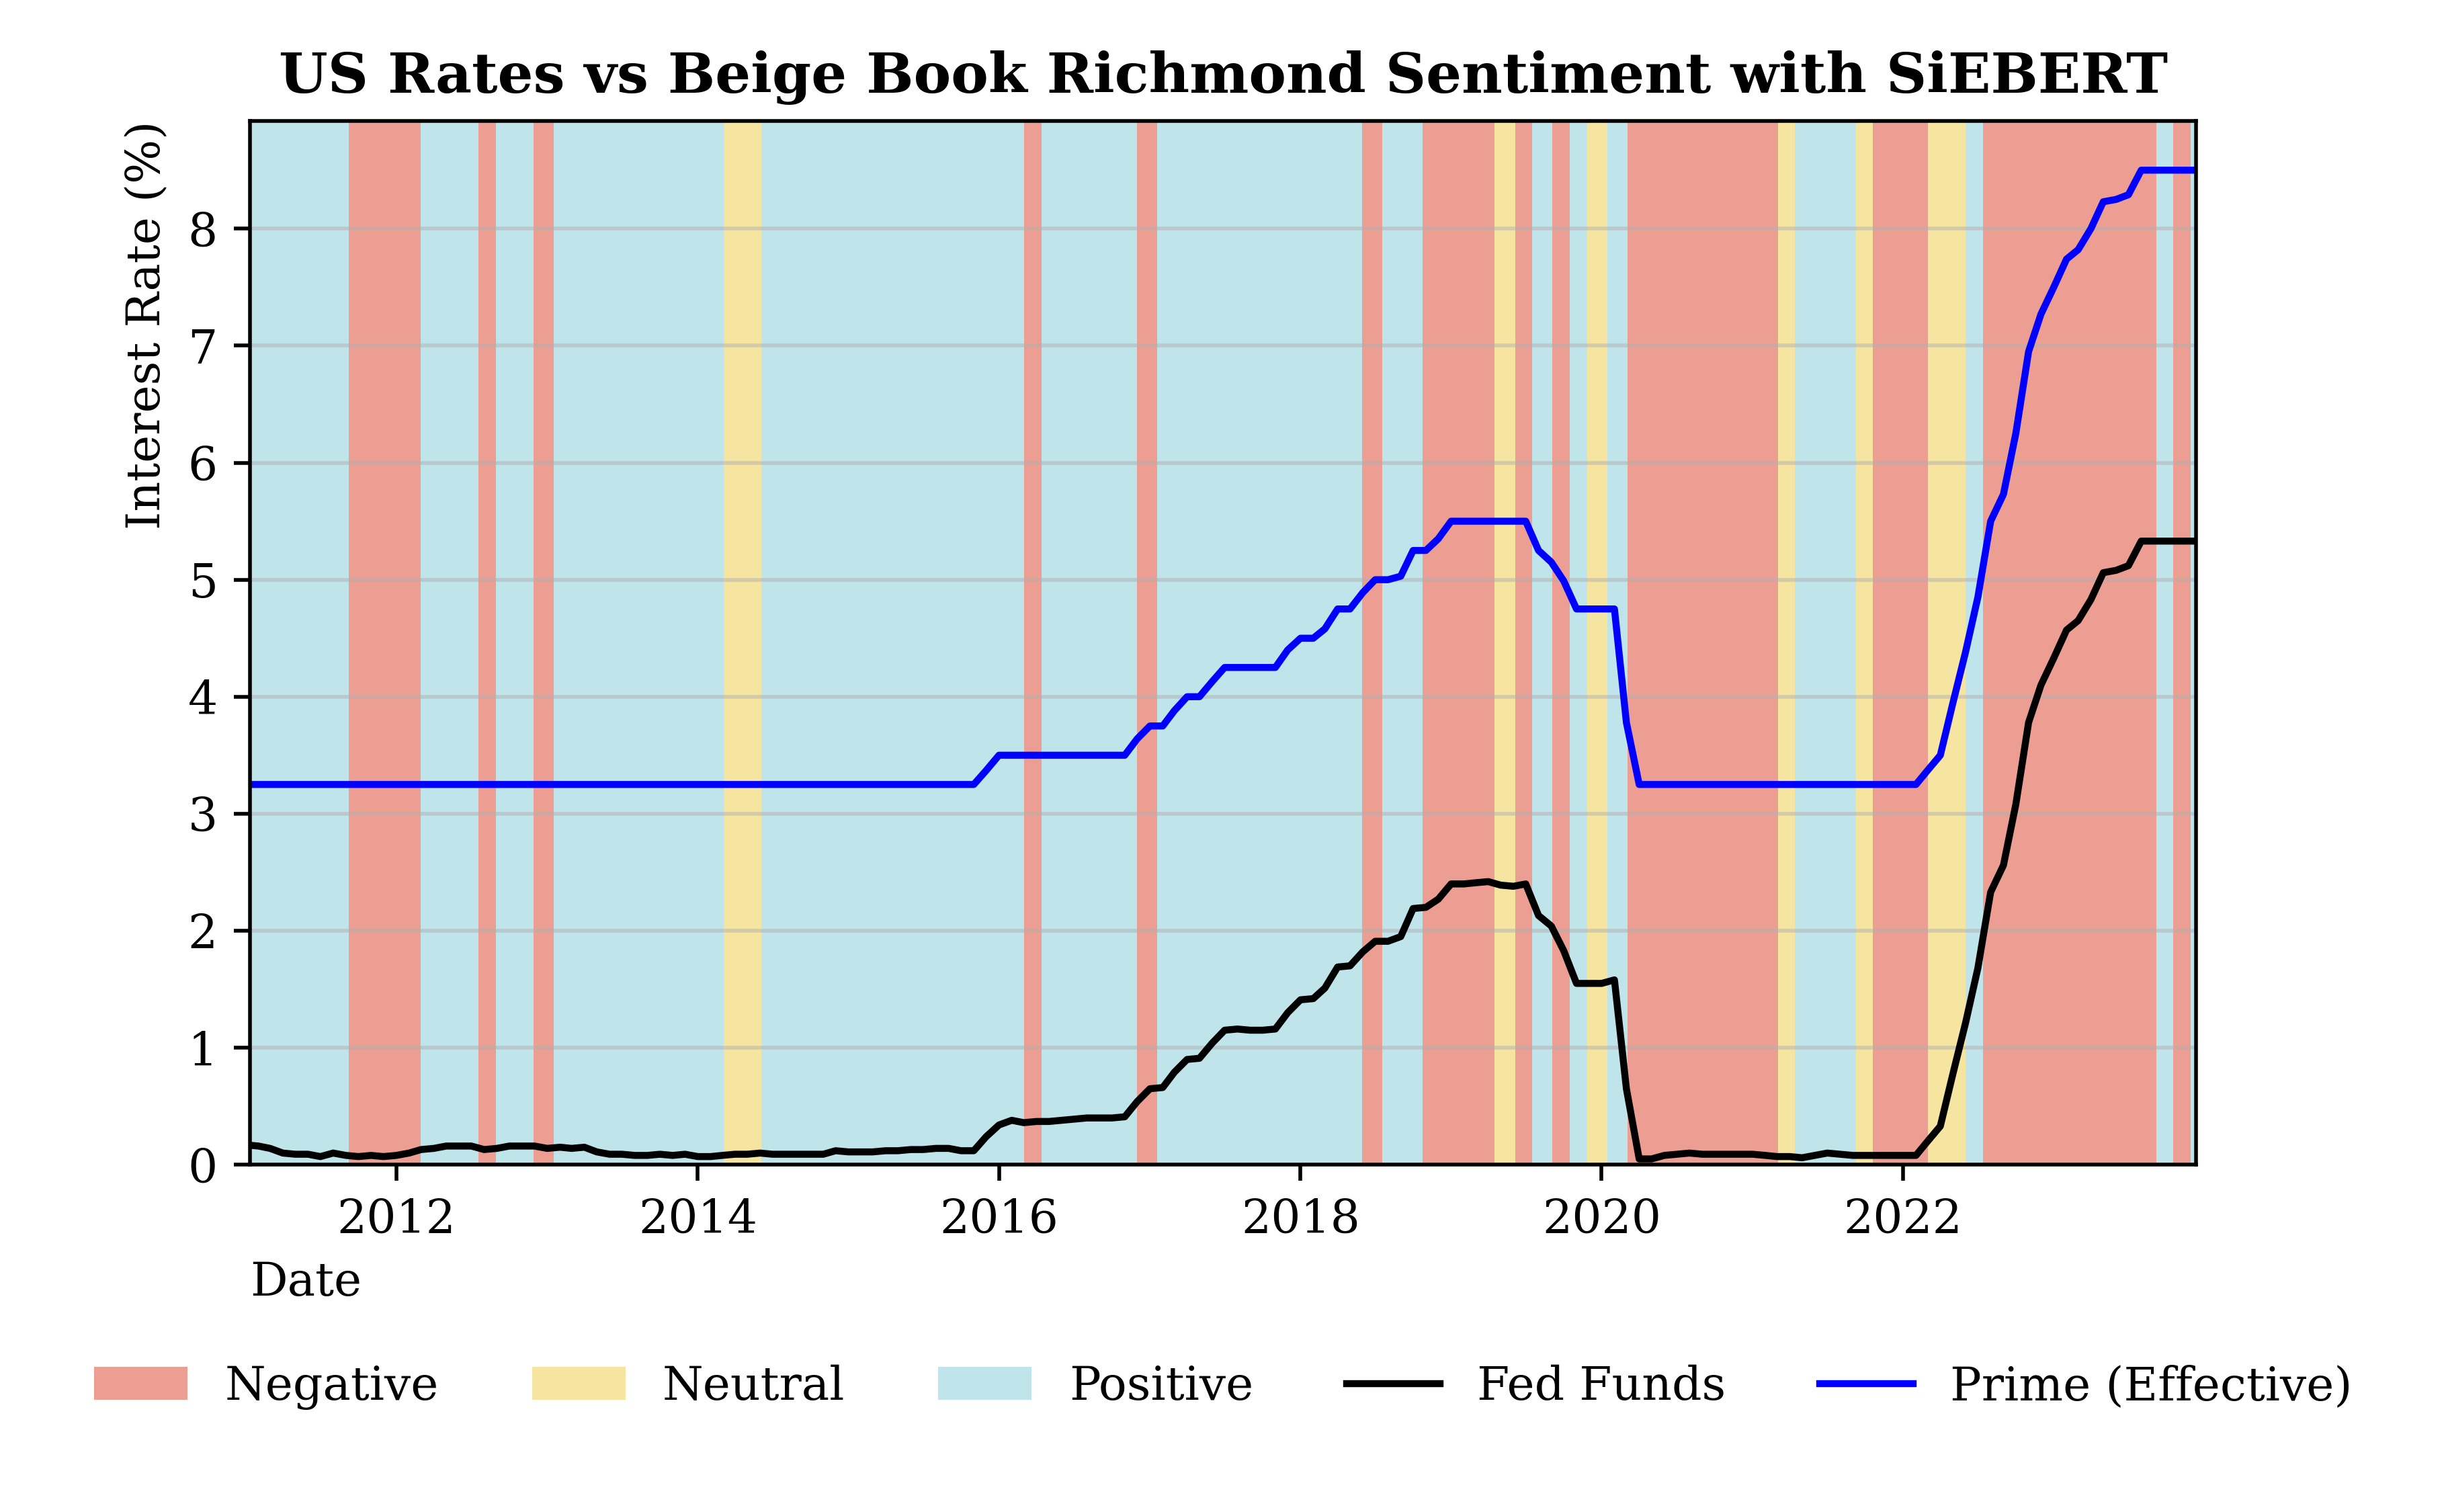
By construction, the Beige Book is a look-back measure and does not have very strong predictive power. The only interesting correlation was with interest rates, which is expected given that the Fed uses the Beige Book to inform its decisions. We note, however, that interest rates remained stable and very low for most of the sample, which suggests a high likelihood of overfitting in the data.
Methodology
This post refers to my paper Sentiment Analysis with Large Language Models Applied to the Federal Reserve Beige Book, which was published in IntelliSys 2025, Lecture Notes in Networks and Systems, vol 1554 (Springer). A public version is available on SSRN.
I analyzed 104 past Fed Beige books to construct this paper, between 2011 and 2023. I wrote a Python script to extract and represent data from the Fed's website and structure the text of the Beige Books. Notably, their actual structure changed little over time, just as these are displayed on the Fed's website.
When it comes to models, I used HuggingFace, which is a repository with trained models that can be easily imported into Python. You can view in the paper the link to both the models' papers and the Hugging Face repository.
One of the challenges was to differentiate the sentiment of the summary from that of the overall report. The summary is written, albeit in turn, by one of the local Fed members, so there was a chance of bias. I ran the sentiment analysis on both the summary and the overall report, and in most cases found a close match. It is also worth noting that having a large data set helped.
Read more
You can view the references I quote directly in the paper text. LLMs are an area of continuous research, either as generalist models or as smaller, specialized models.
On-Chain NFT
This paper is represented on-chain by NFTs on the following chains. The metadata is compatible with Schema.org JSON-LD standards for agentic AI discovery, parsing, and citation.

Using LLMs to quantify the Fed's Beige Book
Eight times a year, the Federal Reserve publishes a qualitative report that influences trillion-dollar decisions. Can we use LLMs to process it faster?